GeoCalor
Dashboard
Climate and health
Health impacts of heat waves: a dashboard that combines climate and health data for Brazilian metropolitan areas.
Open the GeoCalor dashboard (Portuguese)
GeoCalor studies the impacts of heat waves by combining climate and health data. It focuses on the three most populous metropolitan areas of each region of Brazil.
The dashboard brings together climate characterization, heat waves, epidemiological profile and early warning systems. It helps users see patterns, detect anomalies and support monitoring, risk communication and health planning. The goal is to produce scientific evidence for the Brazilian Unified Health System (SUS).
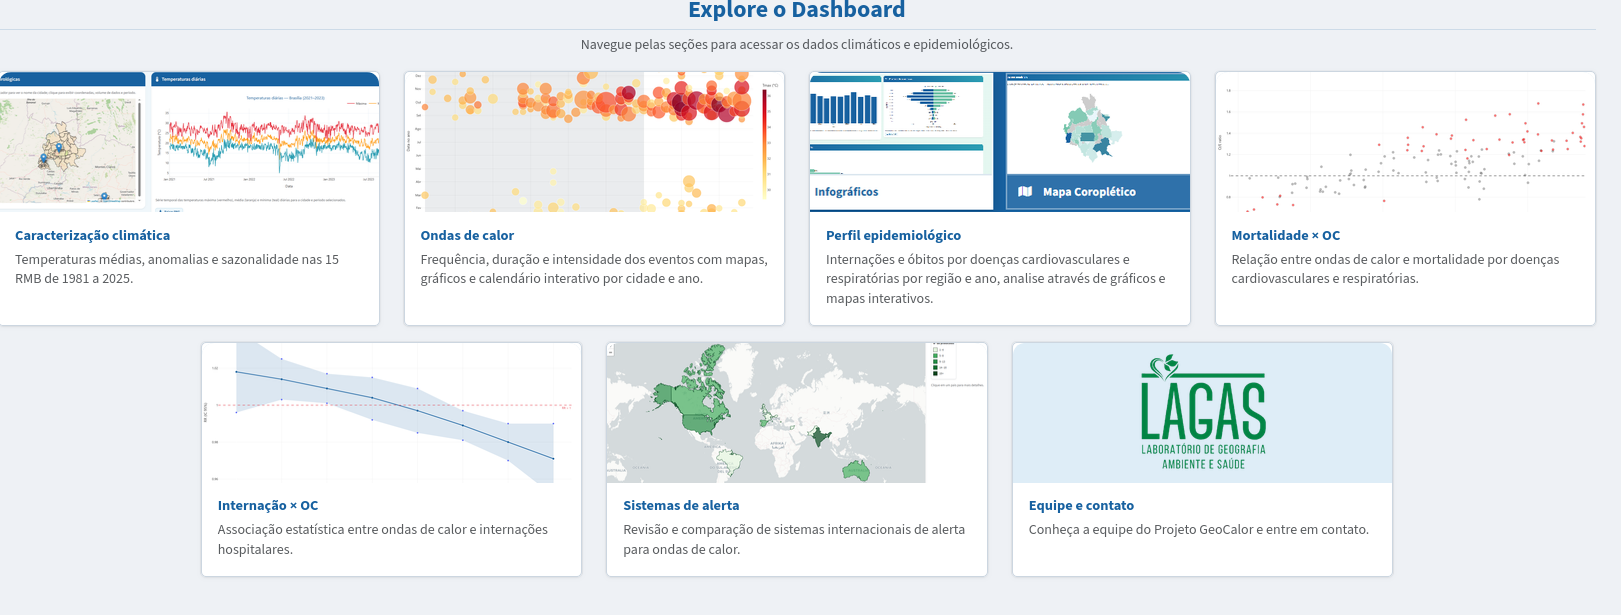
What the dashboard shows
| Section | Content |
|---|---|
| Climate characterization | mean temperatures, anomalies and seasonality in 15 metropolitan areas, 1981–2025 |
| Heat waves | frequency, duration and intensity of events, with maps, charts and a calendar by city and year |
| Epidemiological profile | hospitalizations and deaths from cardiovascular and respiratory diseases, by region and year |
| Mortality × heat waves | relationship between heat waves and cardiovascular/respiratory mortality |
| Hospitalization × heat waves | statistical association between heat waves and hospital admissions |
| Early warning systems | review and comparison of international heat-wave warning systems |
A project of the Laboratory of Geography, Environment and Health (LAGAS/UnB), published by ICICT/Fiocruz.