Level Beginner Reading 9 min Data October 2026 Programs ArcGIS 


PRODES is Brazil’s official deforestation rate, produced by the National Institute for Space Research (INPE). It is released once a year for each biome, and the “PRODES year” runs from August to July. When INPE publishes a new year, the question is always the same: how much was cleared inside each protected area?
I had one script for the Amazon and an almost identical one for the Cerrado. Here it is a single script: the PRODES layer and the set of protected areas become parameters.
What you will do
- Filter the deforestation polygons and repair the geometries.
- Overlay them with the protected areas of each biome (intersection).
- Measure the area in hectares.
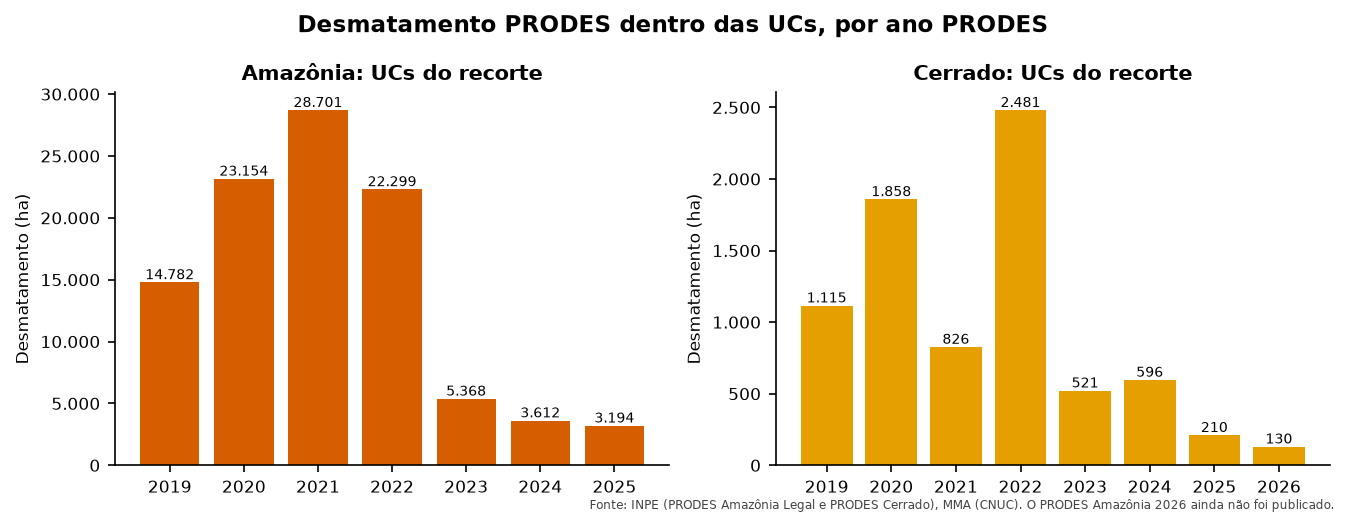
- Summarize: a table of the latest year by protected area, and the time series.
- Update when a new year is released, without duplicating it.
Layers prodes_amz, prodes_cerrado and ucs of the articles’ GeoPackage (how to download). Both PRODES layers have the same fields (year, main_class, area_km), so the same code works for both. The WFS services are:
- Amazon:
https://terrabrasilis.dpi.inpe.br/geoserver/prodes-legal-amz/ows, layerprodes-legal-amz:yearly_deforestation - Cerrado:
https://terrabrasilis.dpi.inpe.br/geoserver/prodes-cerrado-nb/ows, layerprodes-cerrado-nb:yearly_deforestation
The code
Names in Portuguese: bioma = biome, camada = layer, regiao = region, partes = parts, ultimo = latest, ano = year, grupo = protected area group (strict protection or sustainable use).
import arcpy

arcpy.env.overwriteOutput = True
gpkg = r"C:\dados\artigos.gpkg"
gdb = r"C:\dados\resultados.gdb"

biomas = [("Amazônia", "main.prodes_amz", "Amazonia"),
          ("Cerrado", "main.prodes_cerrado", "Cerrado")]
partes = []

for bioma, camada, regiao in biomas:
    # 1. Deforestation (the field comes in upper and lower case) and repaired geometries
    prodes = arcpy.analysis.Select(gpkg + "\\" + camada, rf"memory\prodes_{regiao}",
                                   "UPPER(main_class) = 'DESMATAMENTO'")
    arcpy.management.RepairGeometry(prodes)
    ucs = arcpy.analysis.Select(gpkg + r"\main.ucs", rf"memory\ucs_{regiao}",
                                f"regiao = '{regiao}'")

    # 2 and 3. Intersection and geodesic area
    cruzado = arcpy.analysis.PairwiseIntersect([prodes, ucs], rf"memory\cruzado_{regiao}")
    arcpy.management.CalculateGeometryAttributes(
        cruzado, [["area_ha", "AREA_GEODESIC"]], area_unit="HECTARES")
    arcpy.management.CalculateField(cruzado, "bioma", f"'{bioma}'", "PYTHON3",
                                    field_type="TEXT")
    partes.append(cruzado)

prodes_ucs = arcpy.management.Merge(partes, gdb + r"\prodes_ucs")

# 4. Time series by biome and year, and table by protected area
arcpy.analysis.Statistics(prodes_ucs, gdb + r"\prodes_serie",
                          [["area_ha", "SUM"]], ["bioma", "year"])
arcpy.analysis.Statistics(prodes_ucs, gdb + r"\prodes_por_uc",
                          [["area_ha", "SUM"]], ["bioma", "year", "nome_uc", "grupo"])

# Latest year of each biome
for bioma, _, _ in biomas:
    anos = [r[0] for r in arcpy.da.SearchCursor(prodes_ucs, ["year"], f"bioma = '{bioma}'")]
    arcpy.AddMessage(f"{bioma}: latest year = {max(anos)}")
import processing
G = "C:/dados/artigos.gpkg"
def rodar(alg, **p):
p.setdefault("OUTPUT", "memory:")
return processing.run(alg, p)["OUTPUT"]
partes = []
for bioma, camada, regiao in [("Amazônia", "prodes_amz", "Amazonia"),
("Cerrado", "prodes_cerrado", "Cerrado")]:
# 1. Deforestation and repaired geometries
prodes = rodar("native:extractbyexpression", INPUT=f"{G}|layername={camada}",
EXPRESSION="upper(main_class) = 'DESMATAMENTO'")
prodes = rodar("native:fixgeometries", INPUT=prodes)
ucs = rodar("native:extractbyexpression", INPUT=f"{G}|layername=ucs",
EXPRESSION=f"regiao = '{regiao}'")
# 2 and 3. Intersection, area in hectares and biome
cruzado = rodar("native:intersection", INPUT=prodes, OVERLAY=ucs,
INPUT_FIELDS=["year"], OVERLAY_FIELDS=["cnuc", "nome_uc", "grupo"])
cruzado = rodar("native:fieldcalculator", INPUT=cruzado, FIELD_NAME="area_ha",
FIELD_TYPE=0, FIELD_PRECISION=4,
FORMULA="area(transform($geometry, 'EPSG:4674', 'ESRI:102033')) / 10000")
cruzado = rodar("native:fieldcalculator", INPUT=cruzado, FIELD_NAME="bioma",
FIELD_TYPE=2, FIELD_LENGTH=10, FORMULA=f"'{bioma}'")
partes.append(cruzado)
prodes_ucs = rodar("native:mergevectorlayers", LAYERS=partes, CRS="EPSG:4674")
# 4. Sum by biome, year and protected area; then only the latest year of each biome
por_uc = rodar("qgis:statisticsbycategories", INPUT=prodes_ucs, VALUES_FIELD_NAME="area_ha",
CATEGORIES_FIELD_NAME=["bioma", "year", "nome_uc"])
ultimo = rodar("native:extractbyexpression", INPUT=por_uc,
EXPRESSION='"year" = maximum("year", group_by:="bioma")')
for f in ultimo.getFeatures():
print(f["bioma"], f["year"], f["nome_uc"], round(f["sum"], 1))The trick is in the last expression: maximum("year", group_by:="bioma") finds the latest year of each biome, and the same idea works in the Field Calculator and in layer filters.
-- 1 to 3. Both biomes in a single table
DROP TABLE IF EXISTS artigos.prodes_ucs;
CREATE TABLE artigos.prodes_ucs AS
WITH prodes AS (
    SELECT 'Amazônia' AS bioma, 'Amazonia' AS regiao, year AS ano,
           ST_CollectionExtract(ST_MakeValid(geom), 3) AS geom
    FROM artigos.prodes_amz
    WHERE upper(main_class) = 'DESMATAMENTO'
    UNION ALL
    SELECT 'Cerrado', 'Cerrado', year,
           ST_CollectionExtract(ST_MakeValid(geom), 3)
    FROM artigos.prodes_cerrado
    WHERE upper(main_class) = 'DESMATAMENTO'
)
SELECT p.bioma, p.ano, u.cnuc, u.nome_uc, u.grupo,
       ST_Intersection(p.geom, u.geom) AS geom
FROM prodes p
JOIN artigos.ucs u ON u.regiao = p.regiao AND ST_Intersects(p.geom, u.geom)
WHERE NOT ST_IsEmpty(p.geom);

ALTER TABLE artigos.prodes_ucs ADD COLUMN area_ha numeric;
UPDATE artigos.prodes_ucs SET area_ha = ST_Area(geom::geography) / 10000;

-- 4a. Latest year of each biome, by protected area
SELECT bioma, ano, nome_uc, grupo, count(*) AS poligonos, round(sum(area_ha), 1) AS area_ha
FROM artigos.prodes_ucs p
WHERE ano = (SELECT max(ano) FROM artigos.prodes_ucs q WHERE q.bioma = p.bioma)
GROUP BY bioma, ano, nome_uc, grupo
ORDER BY bioma, area_ha DESC;

-- 4b. Time series
SELECT ano,
       round(sum(area_ha) FILTER (WHERE bioma = 'Amazônia')) AS amazonia_ha,
       round(sum(area_ha) FILTER (WHERE bioma = 'Cerrado')) AS cerrado_ha
FROM artigos.prodes_ucs
GROUP BY ano
ORDER BY ano;
import geopandas as gpd
import pandas as pd
G = "dados/artigos.gpkg"
ucs = gpd.read_file(G, layer="ucs")
def corrigir(gdf):
gdf["geometry"] = gdf.make_valid(method="structure", keep_collapsed=False)
return gdf[~gdf.is_empty]
def prodes_em_ucs(camada, regiao, bioma):
"""Overlays a PRODES layer with the protected areas of a region and measures in hectares."""
prodes = gpd.read_file(G, layer=camada)
prodes = corrigir(prodes[prodes["main_class"].str.upper() == "DESMATAMENTO"])
u = ucs[ucs["regiao"] == regiao][["cnuc", "nome_uc", "grupo", "geometry"]]
x = gpd.overlay(prodes[["year", "geometry"]], u, how="intersection", keep_geom_type=True)
x["area_ha"] = x.to_crs("ESRI:102033").area / 10_000
return x.assign(bioma=bioma).rename(columns={"year": "ano"})
prodes_ucs = pd.concat([prodes_em_ucs("prodes_amz", "Amazonia", "Amazônia"),
prodes_em_ucs("prodes_cerrado", "Cerrado", "Cerrado")])
# 4a. Latest year of each biome, by protected area
ultimo = prodes_ucs[prodes_ucs["ano"] == prodes_ucs.groupby("bioma")["ano"].transform("max")]
print(ultimo.groupby(["bioma", "ano", "nome_uc", "grupo"])
.agg(poligonos=("area_ha", "size"), area_ha=("area_ha", "sum"))
.round(1).sort_values("area_ha", ascending=False))
# 4b. Time series
print(prodes_ucs.pivot_table(index="ano", columns="bioma", values="area_ha",
aggfunc="sum").round())Checking the result
The three tested versions (QGIS, PostGIS and Python) gave the same totals, with differences below 0.1%.
| Biome | PRODES year | Protected area | Group | Polygons | Area (ha) |
|---|---|---|---|---|---|
| Amazon | 2025 | Jamanxim National Forest | Sustainable use | 120 | 1,569.7 |
| Amazon | 2025 | Tapajós Environmental Protection Area | Sustainable use | 69 | 1,251.6 |
| Amazon | 2025 | Altamira National Forest | Sustainable use | 35 | 269.5 |
| Amazon | 2025 | Iriri State Forest | Sustainable use | 9 | 59.4 |
| Amazon | 2025 | Jamanxim National Park | Strict protection | 3 | 27.0 |
| Amazon | 2025 | Rio Novo National Park | Strict protection | 4 | 16.7 |
| Cerrado | 2026 | Pouso Alto Environmental Protection Area | Sustainable use | 37 | 129.7 |
Chapada dos Veadeiros National Park had no PRODES deforestation in 2026. Note also that, in both biomes, almost all deforestation inside protected areas is in sustainable-use areas, where people live and some activities are allowed.
Updating when a new year is released
INPE sometimes republishes a year (with corrections). If your script only appends rows, the same year appears twice and the area doubles. The rule is: delete the year and insert it again, in a transaction.
ano = 2025
tabela = gdb + r"\prodes_ucs_historico"
with arcpy.da.UpdateCursor(tabela, ["year"], f"year = {ano} AND bioma = 'Amazônia'") as cur:
    for _ in cur:
        cur.deleteRow()
novos = arcpy.analysis.Select(prodes_ucs, r"memory\novos", f"year = {ano} AND bioma = 'Amazônia'")
arcpy.management.Append(novos, tabela, "NO_TEST")
In QGIS, the safest option is to rewrite the whole layer at each update (the overlay takes seconds). To edit an existing table, select the year with Select by expression ("year" = 2025), delete the selected features and use Edit → Paste features with the new data.
BEGIN;
DELETE FROM artigos.prodes_ucs WHERE bioma = 'Amazônia' AND ano = 2025;
INSERT INTO artigos.prodes_ucs (bioma, ano, cnuc, nome_uc, grupo, geom, area_ha)
SELECT bioma, ano, cnuc, nome_uc, grupo, geom, area_ha
FROM artigos.prodes_ucs_novo            -- the same overlay, only with the new year
WHERE bioma = 'Amazônia' AND ano = 2025;
COMMIT;
If something goes wrong between the DELETE and the INSERT, ROLLBACK undoes everything and the table is never left half-done.
historico = gpd.read_file("dados/prodes_ucs_historico.gpkg")
ano, bioma = 2025, "Amazônia"
novos = prodes_ucs[(prodes_ucs["ano"] == ano) & (prodes_ucs["bioma"] == bioma)]
historico = pd.concat([historico[~((historico["ano"] == ano) & (historico["bioma"] == bioma))],
                       novos])
historico.to_file("dados/prodes_ucs_historico.gpkg")
The article Updating layers without duplicates covers this pattern in detail.
Pitfalls
In the Amazon study area, 3 polygons from 2024 come with main_class = 'desmatamento' (lower case) and 1,635 with 'DESMATAMENTO'. A filter main_class = 'DESMATAMENTO' misses the three. Always compare with UPPER(...).
2,263 of the 11,126 PRODES Amazon polygons in the study area (20%) are invalid. The old script had the RepairGeometry line commented out and worked by luck. Always repair before the overlay.
area_km is already in the table, why recompute it?
INPE’s area_km is the area of the whole polygon. After the intersection, a polygon that crosses the protected area boundary keeps only the part inside, and the original area_km is wrong. Always recompute after cutting.
See also
- Inside and around protected areas
- Monthly cumulative table, for DETER, which is updated daily
Updates
- 2026-10-29: first published, with data from INPE, MMA, IBAMA and SICAR from October 2026.
Reuse
Citation
@misc{alves2026,
  author = {Alves, Hendesson},
  publisher = {Hendesson Alves},
  title = {Annual {PRODES} Deforestation in Protected Areas of the
    {Amazon} and the {Cerrado}},
  date = {2026-10-29},
  url = {https://hendesson.github.io/en/articles/03-prodes-protected-areas.html},
  doi = {10.5281/zenodo.23780250},
  langid = {en},
  abstract = {One script to overlay PRODES for the Amazon and the
    Cerrado with protected areas, build the table by protected area and
    the time series, and add a new year without duplicating it. In both
    biomes, almost all deforestation inside protected areas happens in
    sustainable-use areas.}
}